Setting the Stage
When I was graduating high school, my dad had a moment of genius. He gave me a small amount of money to open a brokerage account to start investing in the stock market. Even though the amount of money was small (maybe $1000), I was given a valuable opportunity to jump in and learn a lot about investing, without much at stake.
Back in 1998, I invested in a small number of stocks. I didn’t have a real strategy other than I wanted to invest in companies I liked and that I felt would continue to grow in the future. Most of my decisions were based on qualitative reasoning. For example, in the late 90’s, the internet was just emerging as the huge success it is today. I chose to invest in FedEx because I believed that more people were going to buy stuff online rather than traditional brick-and-mortar stores and all that stuff would need to be shipped by either UPS, FedEx, or the Post Office. The growth of China was also constantly in the news so I thought that Caterpillar (CAT) would prosper due to all the construction equipment they would be selling to China as the country developed its infrastructure. That was the degree of thought that led me to buy these particular stocks.
Around that time, I bought the following stocks. As I’ve always taken a buy-and-hold approach, I still own most of these stocks today. For the most part, I split my initial investment evenly between these five stocks.
Caterpillar, CAT
FedEx, FDX
Microsoft, MSFT
3M, MMM
Barnes and Noble, BKS
For the past month or two, I’ve been taking an online course from the University of Washington titled Introduction to Computational Finance and Financial Econometrics. I’ve learned a ton in the past 9 weeks from both the lectures and the programming exercises in R. After taking this class on computational finance, I thought it would be interesting to compare the results of that initial portfolio with what could have been achieved using the Markowitz theory and the assumption of constant expected returns. Essentially, the goal is to determine the optimal mix of a given set of stocks to minimize the amount of risk you are taking to achieve a given return. The crazy thing is that even after all this high-level analysis, there is no guarantee that you would be better than just dumping your money in an index fund or selecting some random mixture of the stocks.
How did the original portfolio perform over the past 16 years?
The following chart shows how much $1 invested in the summer of 1998 is worth today (end of October 2014). For example, $1 invested in CAT in 1998 is now worth approximately $5.75. Alternatively, 1$ invested in BKS is only worth about $1 today. With that $1000 investment split evenly between these 5 stocks, the current value of that portfolio would be $3969. For comparison, the same money invested in the S&P 500 would be worth $2308. Ironically, this portfolio would have significantly outperformed the S&P500, although I am confident this was simple luck, nothing more.

If it was 1998, what would be the global minimum variance portfolio?
The minimum variance portfolio is the mixture of stocks that is predicted to be the least risky. To calculate the MVP, we need to figure out some statistics of the stocks. We will use the data from 1993-1998 to quantify the statistics. The average and variance of monthly returns for these five stocks are shown below.
| CAT | FDX | MSFT | MMM | BKS | |
| Mean | 0.0196 | 0.0145 | 0.0416 | 0.0152 | 0.0199 |
| Variance | 0.0046 | 0.0063 | 0.0065 | 0.0028 | 0.0096 |
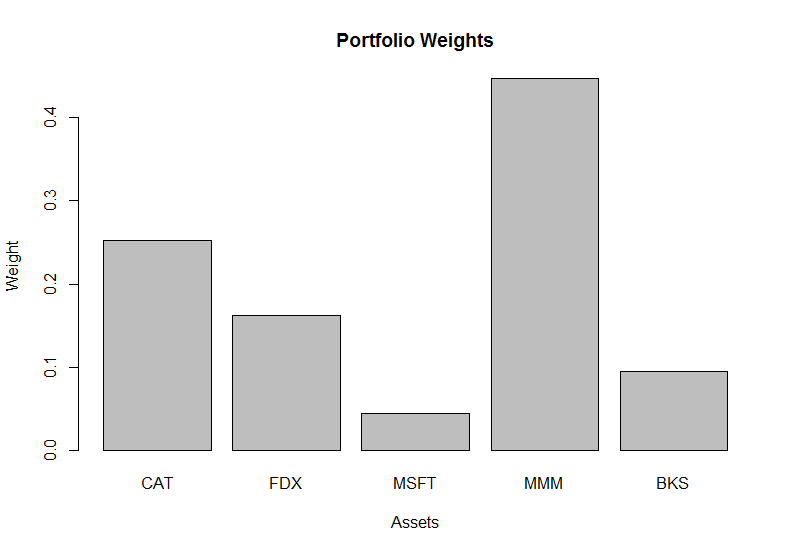
Using these statistics, we can determine the global minimum variance portfolio – the mixture of stocks that have the lowest risk based on the statistics from the past five years. The weights of each stock in the global minimum variance portfolio are shown graphically below. The predicted performance of this portfolio was 1.7% per month with a standard deviation of 3.9% per month.
 What would be the efficient portfolio for these stocks?
The efficient frontier is the maximum expected return you can expect to achieve for a given risk level, as measured with the portfolio standard deviation. The global minimum variance portfolio is the left-most point on the efficient frontier shown below. As you can see, there are other options along the efficient frontier with greater potential returns but with greater risk (x-axis). The exact portfolio you choose is basically determined by your risk tolerance. If you don’t mind taking on more risk, you can potentially get much larger returns. When all said is done, because the stock returns are all over the place, even the efficient frontier has a lot of uncertainty.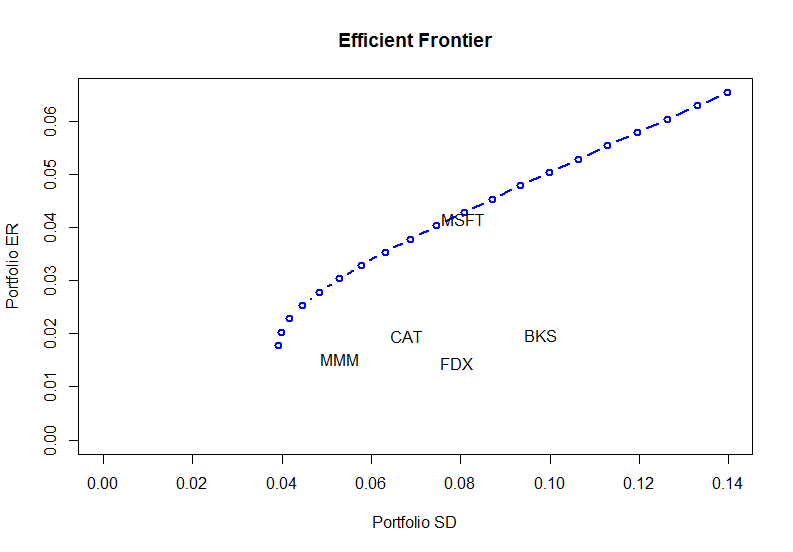 How would the global minimum variance portfolio would have performed since 1998?
The global minimum variance portfolio would increase from $1000 to $4911, which is much better than both my equally weighted stock portfolio ($3970) and the S&P500 ($2308). Recall that the global minimum variance portfolio was intended to represent the least risk although it did amazingly well over that 16 year time horizon. I admit that 16 year time horizon is probably longer than typical but these are definitely nice results. With that being said, I’m still going to be piling all my savings into index ETFs.
